Concept map (or ‘knowledge map’) template was created based on Learning Analytics and Knowledge conference programme. Concept map data was then assessed by each participant based on their prior mastery and feelings towards the concepts. Relations were also asked to be drawn between concepts.
During the workshop participants designed the questions in which the dasbhoard should answer to.
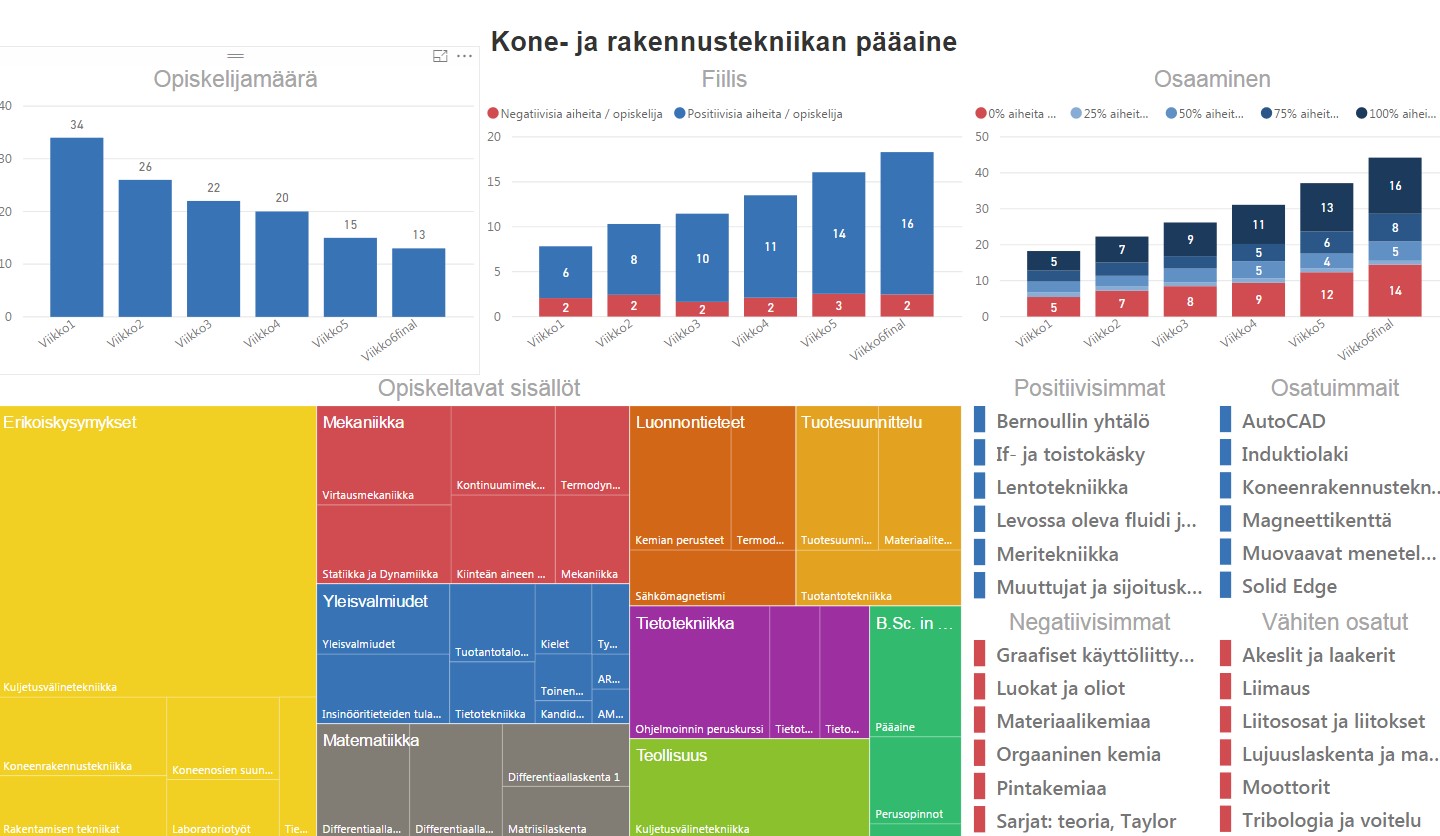
Which conference topics are percieved as most controversial?
Who are the best experts in each field/theme?
How does my relations network relate to network drawn from all participants?
The concept map exercise is still online. This means that you can still map yourself to Learning Analytics and Knowledge conference programme: update your mastery, attach emoticons and draw relations. Updates to the dashboard around 12:30 pm (Sydney timezone). To do this: Map yourself to #LAK18 programme!
Learning Analytics and Knowledge conference and our workshop soon here!
Our pre-conference workshop is about how to use concept maps for students’ self-assessment and then build learning analytics dashboards using the data aggregated from the concept maps.
Now we invite you to take part in this co-creation process. This exercise will get you aquainted with our methodology and help you prepare for Learning Analytics and Knowledge 2018 conference!
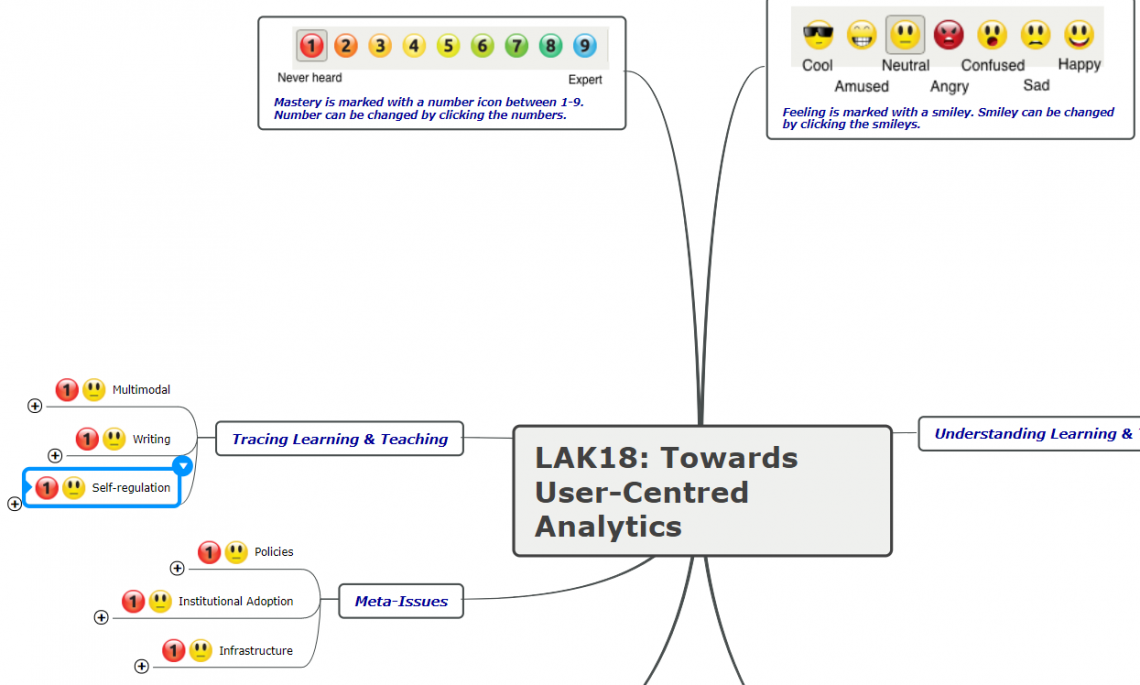
We would like you to mark your mastery and feeling related to different themes and sessions of LAK18 on a concept map.
Mastery is marked with a number icon between 1-9. Number can be changed by clicking the numbers.
Feeling is marked with a smiley. Smiley can be changed by clicking the smileys.
You are also encouraged to find relationships between different themes and/or sessions, and give a label to the relationships.
A dashboard will be built using the data inserted and used in the workshop session.
Browse and fill your concept map as you wish. It is yours, but do note: we will use the provided data to create a dashboard for conference participants.
Submit your assignment. Assignment opens up in a new tab. The submit button is at your assignment’s ‘home tab’.
You can register with your e-mail or register with a temporary account. Concept map can be edited online or offline with desktop software version. When you’re happy with the updates, submit it. You can later unsubmit it if you feel like it and make modifications to the contents.
Beautiful winter day at Riga with all the reasons to stay out:
Beautiful Riga harbour view on 16 January 2018.
But no, they came to listen to our lecture on academic advising, concept mapping, reporting and using those in leading a degree programme titled:
“Improving students’ learning experience in higher education”
With lectures on:
Program Leading Example: Work-life Skills Integration for Marine Technology M.Sc. Studies (Plan the teaching events, Do them, Check the perfomance/ gaps, Act to fill them).
and
Putting Learning Analytics into Practice Utilizing Concept Mapping: From Learning Assignment to a Portfolio Illustrating Student’s Personal Study Plans
by:
Jani Romanoff: Professor, Department of Mechanical Engineering, Aalto University
Ville Kivimäki: Project manager,Dean’s Unit of the School of Engineering, Aalto University
and
Joonas Pesonen: A former project manager in CSC – IT Center for Science (leading data infrastructure modernization project for Finnish education & research data)
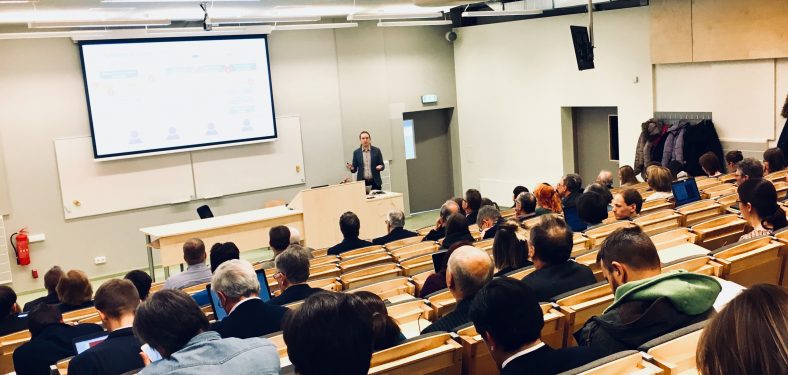
Joonas Pesonen giving a lecture on IT system architecture used in ConceptmapAnalytics
Some 80 showed up. Some came from other Latvian universities, but most were from Riga Technical University.
After the lecture we had great discussions with participants. Our approach seemed to draw a lot of interest. We had great time at Riga. Hope we will meet again.
Don’t remember to register and attend our workshop at #LAK18 and dig deeper in changing education using learning analytics through concept mapping.
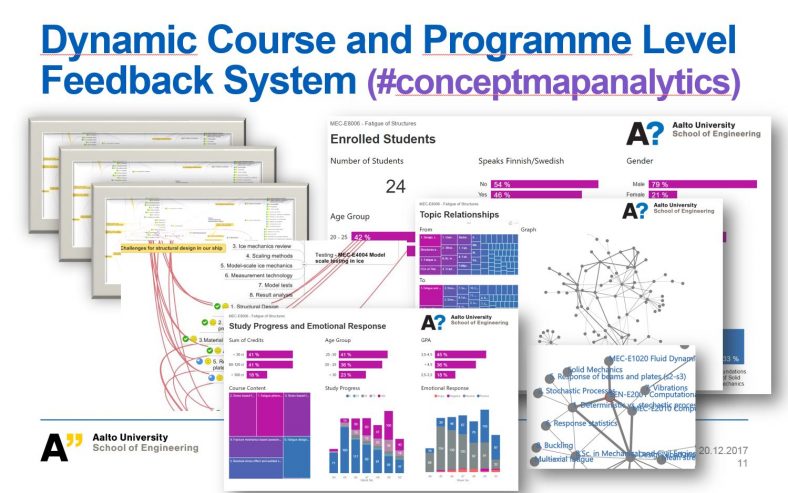
We had a demo and talk at a gala event in Aalto University 20 December 2017.
Conceptmaps and dashboards aggregated from many conceptmaps got a lot of attention. We had good discussions on how to utilize conceptmapanalytics as learning assignments, course level knowledge building, degree level personal study planning tool and as a university wide emotional and knowledge building and tracking system to enhance personalized learning.
We also introduced new versions of dashboards that are connected with university’s data warehouse.
Thanks for all the development ideas, critical notions and inspiring discussions.
Our workshop is arranged as a half-day workshop in afternoon. We will co-create dashboards. No previous coding skills needed. Come as you are but prepare to be fantastic with us! We will create something that helps everyone conference visitor to comprehend conference content and relations between different events and presentations. Interesting stuff for sure!
We’re proud to have an opportunity to hold a workshop at #LAK18. In the workshop we will together create analytics dashboards – based on data that you will provide.
Before the conference, workshop attendees will be given a concept map template, built around LAK18 conference programme. Attendees will be asked to complement the concept map template with their knowledge, experiences and emotions about the themes in conference programme.
For the workshop, we will aggregate data from all these complemented concept maps, thus creating a dataset to analyze. We use the conference programme as a way to familiarize us to the technology constraints and possibilities. In addition, we will co-design new approaches creating dashboards for students, teachers, programme leaders and management. From another point of view we will utilize agile hands-on development with our sample data and design ideas for other types of dashboards as well.
Concept map analytics, in our case, started from a rather other direction than dashboards. Spring 2016, Professor Jani Romanoff in Marine Technology introduced Ville with a problem: students were not providing enough feedback. Teachers were getting steady 30% response rates through rigid feedback forms after the course. For sure, this is a big problem for someone who wants to become a better teacher. An idea of a more dynamic feedback system started to formulate.
First funding application
Window of opportunity came when Aalto University launched call for ideas to advance online learning in Aalto University. With some seed funding the problem was defined and the idea of a prototype was launched in December 2016. Idea was to make a concept map of curriculum content, give it to students as a template and ask students to update the concept map weekly. They could add comments to curriculum content, find relationships between content of different courses and add information about their progress. Teachers could then look at the concept maps to get insights about students’ thinking.
From concept to reality
Pilot was funded again for 2017 to start small scale piloting. During year 2017 concept maps were piloted in 8 courses. Also one learning assignment made use of this methodology.
Both students and teachers were extremely happy with the new method. “Teachers’ actually care about us learning!”, one student commented in an interview after the course.
Aggregate, aggregate!
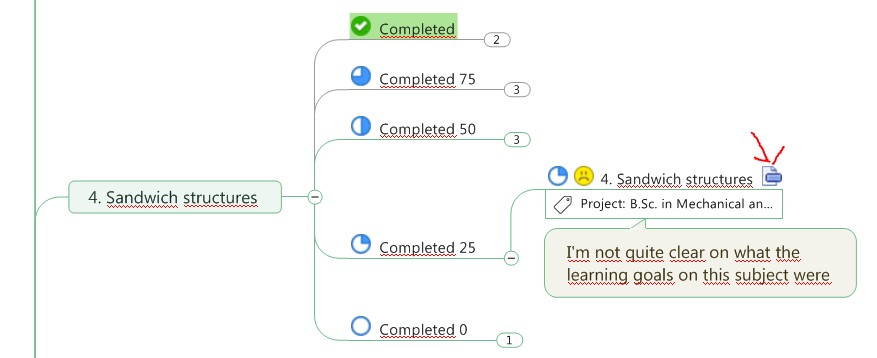
It became clear quite soon, that it is very time consuming for teachers to go through tens of concept maps weekly. We needed a way to get an overview from contents of multiple concept maps at once. As a short term solution, we used a plugin within the mapping software (example of teacher’s view).
In autumn 2017 a more sophisticated aggregation method was built. We wrote a little program which parsed relevant information from multiple concept maps into CSV-files. Then, an analytics dashboard was built using those files and Microsoft Power BI.
Future plans
In near future the dashboard and automation will be developed to meet the needs for more dynamic response for teachers.
Next year another set of courses will join the pilot. The pilot is also negotiating with a full degree programme in Master’s level to take part in piloting starting 2018. Plans include deeper integration with Aalto University’s Learning Management System (Moodle), Student Information System (Oodi) and Data Warehouse.


