-Aleksi Salla
In the beginning of 2020, I started my master’s thesis process under the supervision and advisement of prof Harri Koivusalo and Heidi Salo from Water and Environmental engineering (Aalto University) and Olle Häggblom from Finnish Field Drainage Association. My thesis was part of the VesiHave project, which aims to improve crop productivity and reduce harmful environmental impacts of cultivation by field water management. As the title suggests, my job was to simulate the effects of future climate on the hydrological processes of an experimental field located in Sievi, North Ostrobothnia, Finland. The objective of the thesis was to assess how the controlled drainage affects the field hydrology (especially water table depths and runoffs) and how these impacts might change under future climate conditions. Controlled drainage is a method, where drainage efficiency can be controlled to some extent. This is typically done with control wells, where the drain outlet can be blocked to prevent drain discharge up to some desirable elevation of the groundwater table. The aim is to maintain sufficient soil moisture for the crop and reduce the environmental impacts of drain discharge while enabling sufficient drainage when needed (e.g. when heavy machinery is operated on the field).
In the thesis process, I enjoyed the fact that I was able to work with things relatively new to me, but in which I had gained some interest in my previous studies, such as modeling and programming. In the process, I also obtained more insight into climate change, cultivation and time series analysis as well as working with large quantities of data.
I used a three-dimensional, spatially distributed and process based FLUSH model to simulate four drainage scenarios in two future climatic conditions (best case and worst case scenarios). The simulation input included hourly meteorological data and drain control parameters for years 1970-2100. It came out to be a large dataset with 1147560 rows. The Aalto desktop didn’t even begin to simulate the whole 131 year period, but fortunately I was able to use the CSC supercomputers to run the simulations (IT Center for Science Ltd.). With whopping 1.8 petaflops, so they say, the runs took approximately 35 hours (triple checking the input every time would’ve really saved some time). The output data was even larger with >50 columns of hydrological variables for each scenario, so with the internet connection I had, downloading the data took some time. Then importing the data into a python platform took some time. Of course visually presenting simulation results into beautiful graphs took some time. With all that waiting, shifting between tasks is a skill to be learned for sure.
I worked at home most of the year as most of you due to the pandemic restrictions. No commuting, peaceful solitude in a cosy environment, doing whatever you want on breaks. “What a luxury!”, I thought at first. It turned out it wasn’t. Spending almost all the time at home, lines between work time and free time tended to get really blurry (“I can finish this later” am I right?), and I ended up feeling like having less free time than before. But never I felt like I was alone with my thesis process, thanks to the people I worked with!
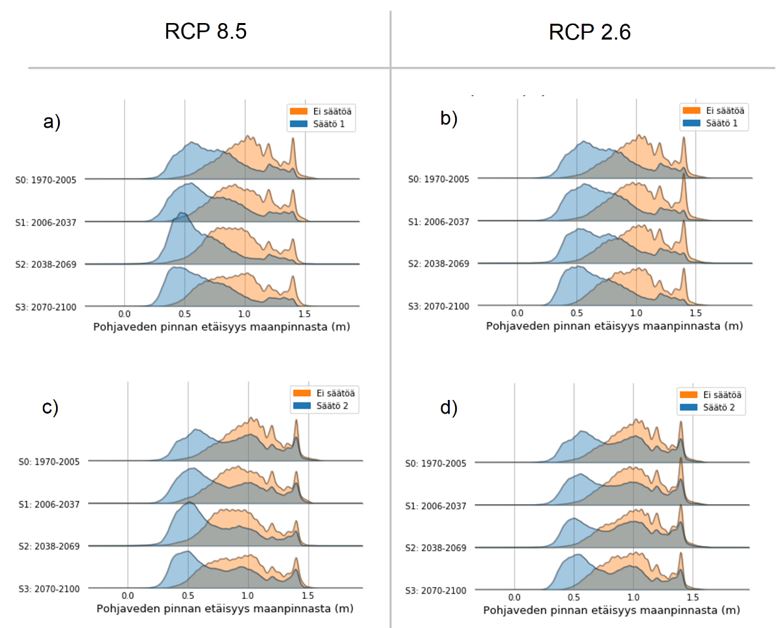
In November 2020 my thesis was approved, and currently I am working on publishing the study as a peer reviewed journal article, hopefully to be published some day! Below you can see an example of my results (Figure 1). The graph shows growing season groundwater table depth distributions for four consecutive time intervals between 1970-2100. Orange is conventional subsurface drainage and blue is controlled drainage (Scenario Säätö 1: reduced drainage efficiency during growing season and from October to March. Scenario Säätö 2: reduced drainage efficiency during growing season and from October to November.) RCP 8.5 is the high-emission scenario and RCP 2.6 is the low-emission scenario. Two things the graph shows: 1) the efficacy of controlled drainage in reducing deep groundwater tables remains similar during the 21st century in both emission scenarios and 2) reducing the drain intensity over winter has a notable impact on summer groundwater levels (Säätö 1 vs. Säätö 2).

Figure 1. Simulated groundwater table depths as frequency distributions during different time intervals (S0–S3) (Salla, 2020).
References
Salla, A. 2020. Säätösalaojitus tulevaisuuden ilmastoskenaarioissa (Eng. Controlled drainage in future climate scenarios). Master’s thesis. Aalto University.


Pingback: Recent news from WRMRG | Water Resources Management and Environmental Hydraulics